
Anúncios
Joint pain can be confusing to track day after day, but a dedicated **joint tracker app** turns scattered symptoms into clear patterns you can actually use. 🦴
Millions of people deal with stiffness, swelling, or unexplained aches without ever connecting the dots between flare-ups and daily habits. An app built specifically for joint health changes that by logging symptoms consistently over time.
Instead of relying on memory during a rushed doctor’s visit, you show up with real data — dates, pain levels, triggers, and trends that tell a much more accurate story.
Why Tracking Joint Symptoms Manually Falls Short#
Most people try to remember their worst joint pain days using mental notes or scattered text messages to themselves. This approach fails for a simple reason: pain memory is unreliable.
Studies on chronic pain recall show that patients tend to overestimate or underestimate past pain intensity depending on how they feel at the moment of recollection. A notebook helps, but it’s easy to forget entries, lose pages, or skip days when symptoms feel “normal.”
A structured app removes that guesswork. It time-stamps every entry and keeps everything searchable, so a flare-up from three months ago is just as visible as one from yesterday.


The Hidden Cost of Inconsistent Records#
When your rheumatologist or physical therapist only gets fragments of information, treatment decisions become harder to fine-tune. Medication adjustments, physical therapy plans, and lifestyle recommendations all depend on accurate symptom history.
- Doctors can’t identify patterns from vague descriptions like “it hurts sometimes”
- Insurance claims for chronic conditions often require documented symptom logs
- Flare-up triggers (weather, diet, activity) stay invisible without consistent notes
Core Features That Make a Joint Health App Worth Using#
Not every symptom tracker is built the same way. The most useful ones for joint and arthritis management share a specific set of features that go beyond basic note-taking.
| Feature | Why It Matters |
|---|---|
| Pain scale logging | Quantifies severity (0-10) for objective comparison over weeks |
| Affected joint mapping | Shows which joints are involved — knees, fingers, hips, shoulders |
| Trigger tracking | Links flare-ups to weather, food, stress, or activity levels |
| Medication reminders | Reduces missed doses that worsen inflammation |
| Exportable reports | Generates PDFs or summaries to share with specialists |
A tool like Arthritis Tracker combines several of these elements into one dashboard, making it easier to spot correlations that would otherwise take months to notice on your own.
Visual Body Maps Change How You Communicate Pain#
One underrated feature is the ability to tap directly on a body diagram to mark where pain occurs. This sounds simple, but it solves a real communication gap.
Describing “my left knee, inner side, worse in the morning” during a 10-minute appointment is hard to do accurately. A visual map does it instantly, and the data accumulates automatically across every logged session.
How Daily Logging Actually Improves Treatment Outcomes#
Rheumatoid arthritis, osteoarthritis, and psoriatic arthritis all follow unpredictable cycles. Some weeks feel manageable; others bring sudden flare-ups with no obvious cause.
Research published in rheumatology journals has repeatedly shown that patient-reported outcome tracking improves the accuracy of treatment adjustments. When doctors see 30 or 60 days of consistent data, they can distinguish between a temporary setback and a pattern that signals the current treatment plan isn’t working.
This matters because arthritis medications — from NSAIDs to biologics — often take weeks to show their full effect. Without tracked data, it’s tempting to switch treatments too early or stick with something ineffective for too long.
Spotting Triggers You Didn’t Know Existed#
Many users discover unexpected patterns once they start logging consistently:
- 🌧️ Barometric pressure drops correlating with joint stiffness
- 🍷 Certain foods (processed sugar, alcohol) linked to next-day swelling
- 😴 Poor sleep quality preceding higher pain scores
- 🏃 Overexertion on “good days” causing crashes 48 hours later
None of these connections are obvious in the moment. They only become visible after weeks of structured data collection — which is exactly what a dedicated app is designed to capture.
Getting Started: A Realistic First-Week Routine#
Opening a new app and trying to log everything perfectly from day one usually leads to burnout. A simpler approach works better long term.
- Day 1-2: Just log pain level and affected joints, nothing else
- Day 3-4: Add one trigger category, like sleep or weather
- Day 5-7: Include medication timing and any activity notes
By the end of one week, you’ll have a baseline. By the end of a month, patterns start emerging that neither you nor your doctor could have guessed beforehand.
Consistency matters more than detail. A quick 30-second entry every day beats a detailed essay written once a week.
Sharing Data With Your Healthcare Team#
One of the most practical benefits of using a joint tracking app is the ability to generate shareable summaries. Instead of trying to verbally reconstruct the last three months during a short appointment, you hand over a clean report.
This typically includes pain trend graphs, flare-up frequency, medication adherence, and notable trigger correlations. Many specialists say this kind of documentation speeds up decision-making significantly, especially when considering changes to biologic therapy or physical therapy referrals.

My Arthritis Tracker & Monitor
Size208.7MB
PlatformAndroid/iOS
PriceFree
Information about size, installs, and rating may change as the app is updated in the official stores.
What a Good Export Report Should Include#
- Date range and total number of logged entries
- Average and peak pain scores per week
- Joints most frequently affected, ranked by frequency
- Medication timeline with missed dose flags
- Notes on lifestyle factors (diet, stress, physical activity)
Bringing this kind of report to an appointment transforms the conversation from “how have you been feeling?” to a focused discussion about specific, measurable trends.
Choosing the Right App for Your Specific Condition#
Joint pain isn’t one single condition — osteoarthritis, rheumatoid arthritis, gout, and fibromyalgia all behave differently. A good tracking app should adapt to your specific situation rather than offering a generic pain diary.
For inflammatory conditions like rheumatoid or psoriatic arthritis, look for apps that track swelling and stiffness duration separately from pain intensity, since morning stiffness lasting over 30 minutes is a key clinical marker doctors watch for.
For osteoarthritis, activity-based pain logging (pain during walking, climbing stairs, gripping objects) tends to be more useful than generic daily scores.
| Condition | Key Metric to Track |
|---|---|
| Rheumatoid Arthritis | Morning stiffness duration, symmetric joint involvement |
| Osteoarthritis | Pain during specific movements, joint stability |
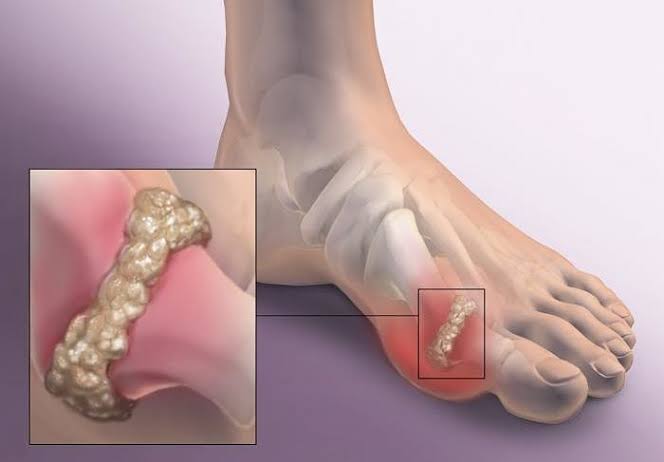
| Gout | Flare frequency, dietary triggers, uric acid correlation |
| Fibromyalgia | Widespread pain points, fatigue levels, sleep quality |
Privacy Considerations Worth Checking Before Downloading#
Since joint health apps store sensitive medical information, it’s worth confirming how data is handled before committing to daily use. Check whether the app encrypts stored data, whether information is shared with third parties, and whether you can export or delete your history at any time.
Apps built specifically for chronic condition management, rather than general wellness tracking, tend to follow stricter data handling practices since they’re designed with medical use cases in mind.
Building a Habit That Actually Sticks#
The biggest obstacle isn’t finding the right app — it’s using it consistently enough to generate useful data. People who succeed usually attach logging to an existing habit, like brushing teeth or taking morning medication.
Setting a daily reminder notification helps during the first two weeks, until the habit feels automatic. After that, most users report that logging takes less time than scrolling through social media for a single post.
The payoff compounds over time. Three months of consistent data gives you and your care team something far more valuable than memory: a clear, visual record of how your joints actually behave, what makes things worse, and what genuinely helps.

Keep reading
You might also like

Metal Detector App: How to Find Hidden Metals Using Your Smartphone
Turning a smartphone into a working metal detector sounds like science fiction, but it's real technology thousands of people already use daily.…

Best Apps to Watch Asian Movies and Dramas Online
Asian cinema has exploded in global popularity, and finding the right app to stream Korean dramas, Japanese anime, and Chinese blockbusters makes…